


Don't Look Down
Pellom Capital Preservation LLC is a private family office registered in the state of Tennessee. Pellom Capital Preservation LLC is not a registered investment advisor with any governing or regulating body. Nothing in this website should be construed as a public offering or solicitation. We do not accept outside funds for our services. We are not professional investment advisors nor do we represent ourselves as such.
The information on this site is not intended to be and should not be treated as legal advice, investment advice, or tax advice. You should discuss all recommended tax strategies and other strategies that may be available to you with your professional investment, legal and accounting advisors before implementing them.
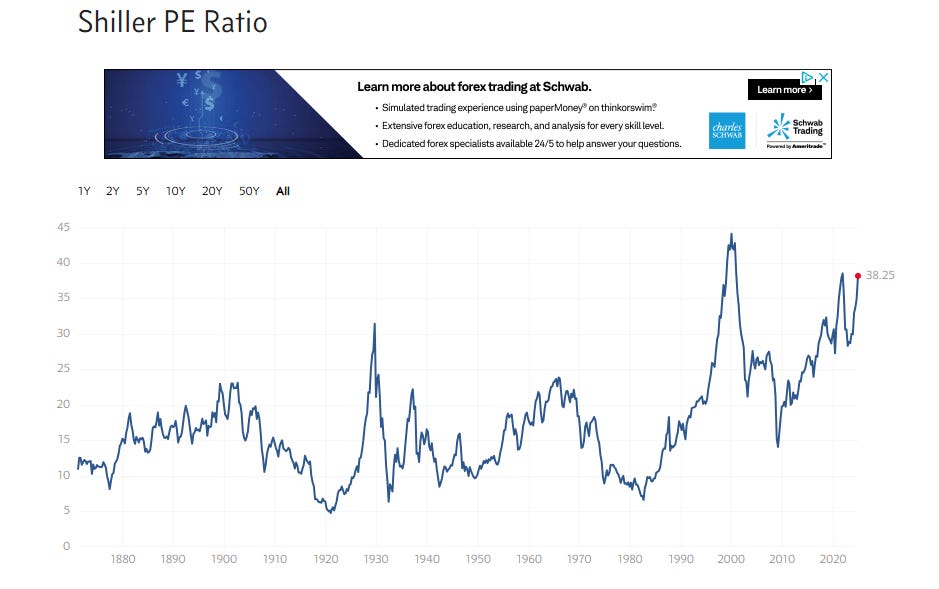
The S&P 500 Shiller CAPE Ratio, also known as the Cyclically Adjusted Price-Earnings ratio, is calculated by dividing the current price of the S&P 500 by the 10-year moving average of its inflation-adjusted earnings. The Shiller Ratio was 38.26 as of 2024-11-01. The median historical value is 15.96.
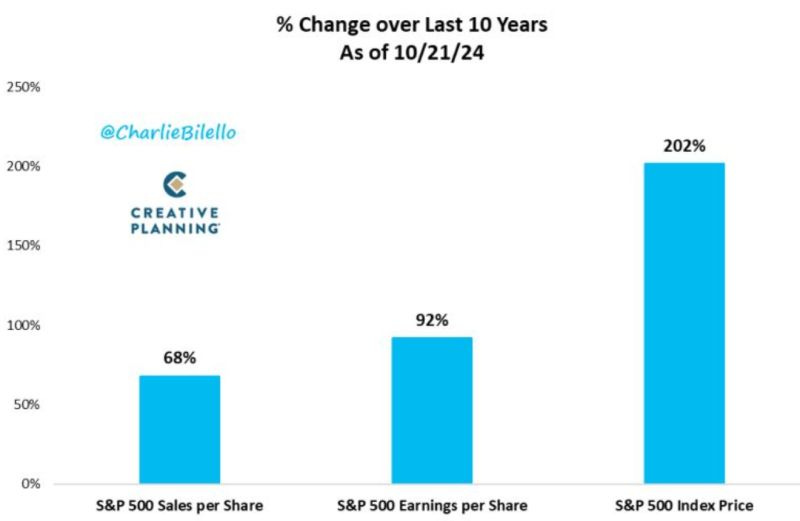
Per Goldman Sachs and
, recent appreciation of equities in the US is mostly due to multiple expansion, not underlying business performance.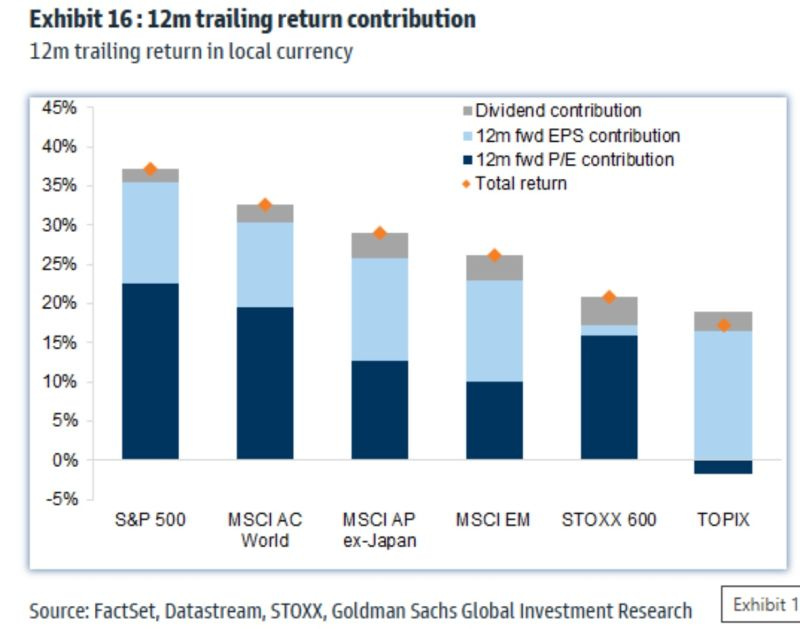
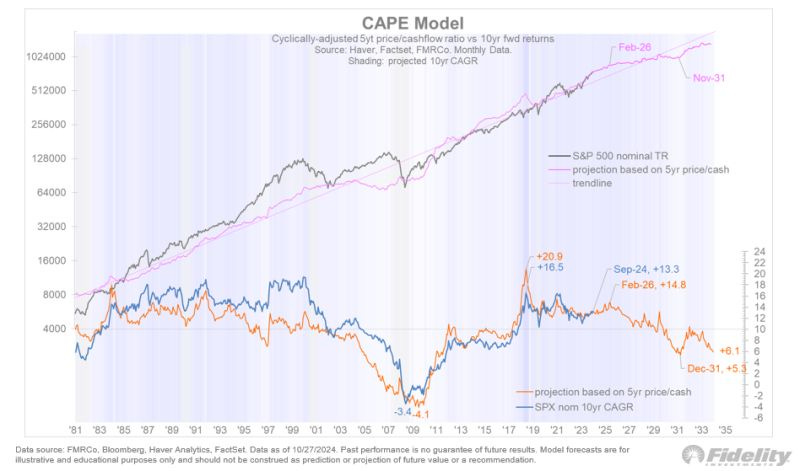
From Jurrien Timmer, Director of Global Macro at Fidelity:
“While the P/E ratio has no predicative qualities over the short-term, they do matter for the long term, as high valuations create a hurdle rate for future gains. A Goldman Sachs paper made a splash last week in calling for a lost decade ahead of mere 3% annual returns. While my CAPE model below shows a better outcome, I agree with the direction of travel: 10-year CAGRs peaked in 2021 and are likely to revert back to trend (10%) and below in the coming years. My version of the CAPE model (using the 5-year price/cash ratio) suggests a 6% CAGR over the coming decade, although it looks like we still have a few years left before the mean reversion sets in.”
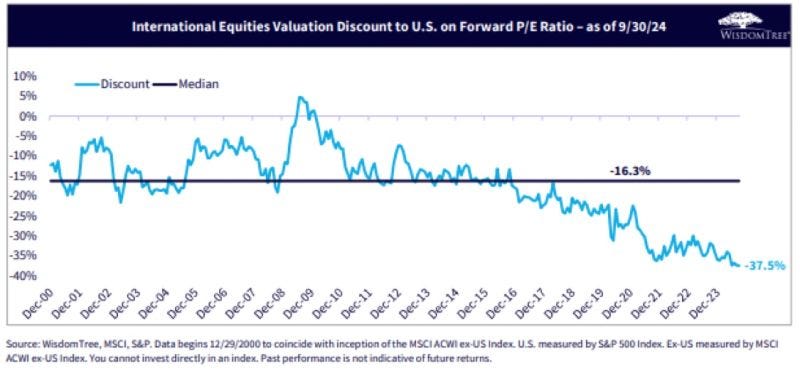
Current valuation gap between US and non-US equities.
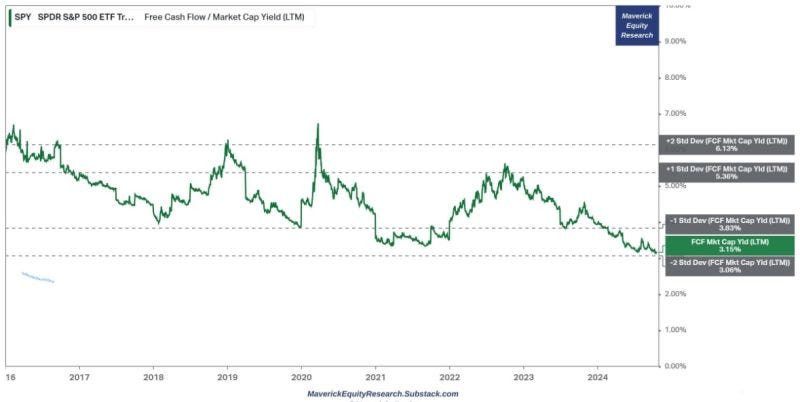
The Free Cash Flow Yield of the S&P 500 is currently 2 standard deviations below its long-term average.
Source:
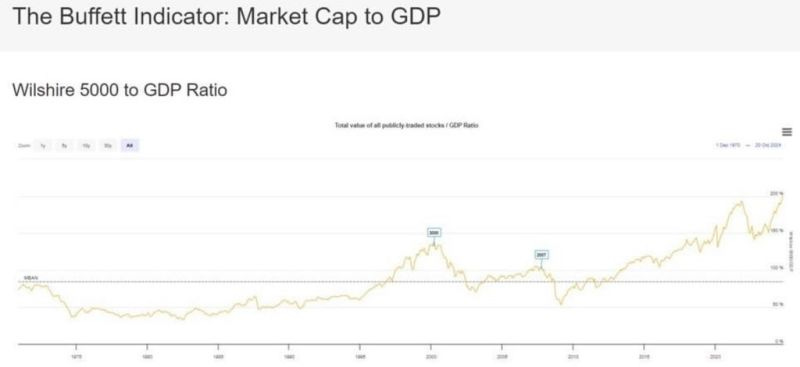
The Warren Buffett Indicator - the Market Cap to GDP ratio - has reached a new all-time high, surpassing levels seen during both 2000 and 2021.
Source: Barchart
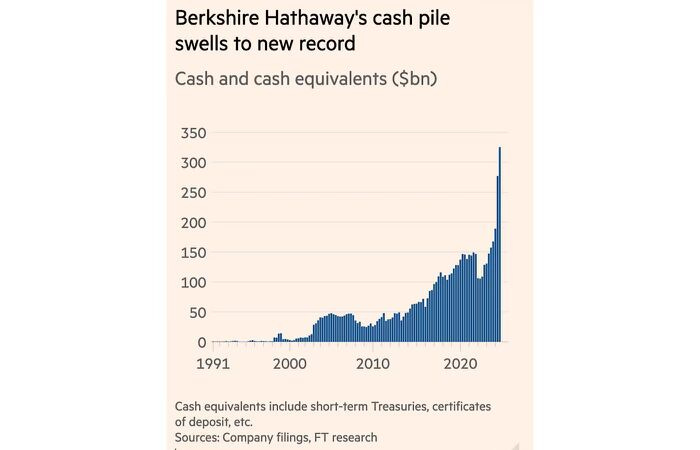
This is how Buffett is responding to the indicator that bears his name:
Good stuff! Thanks Tyler